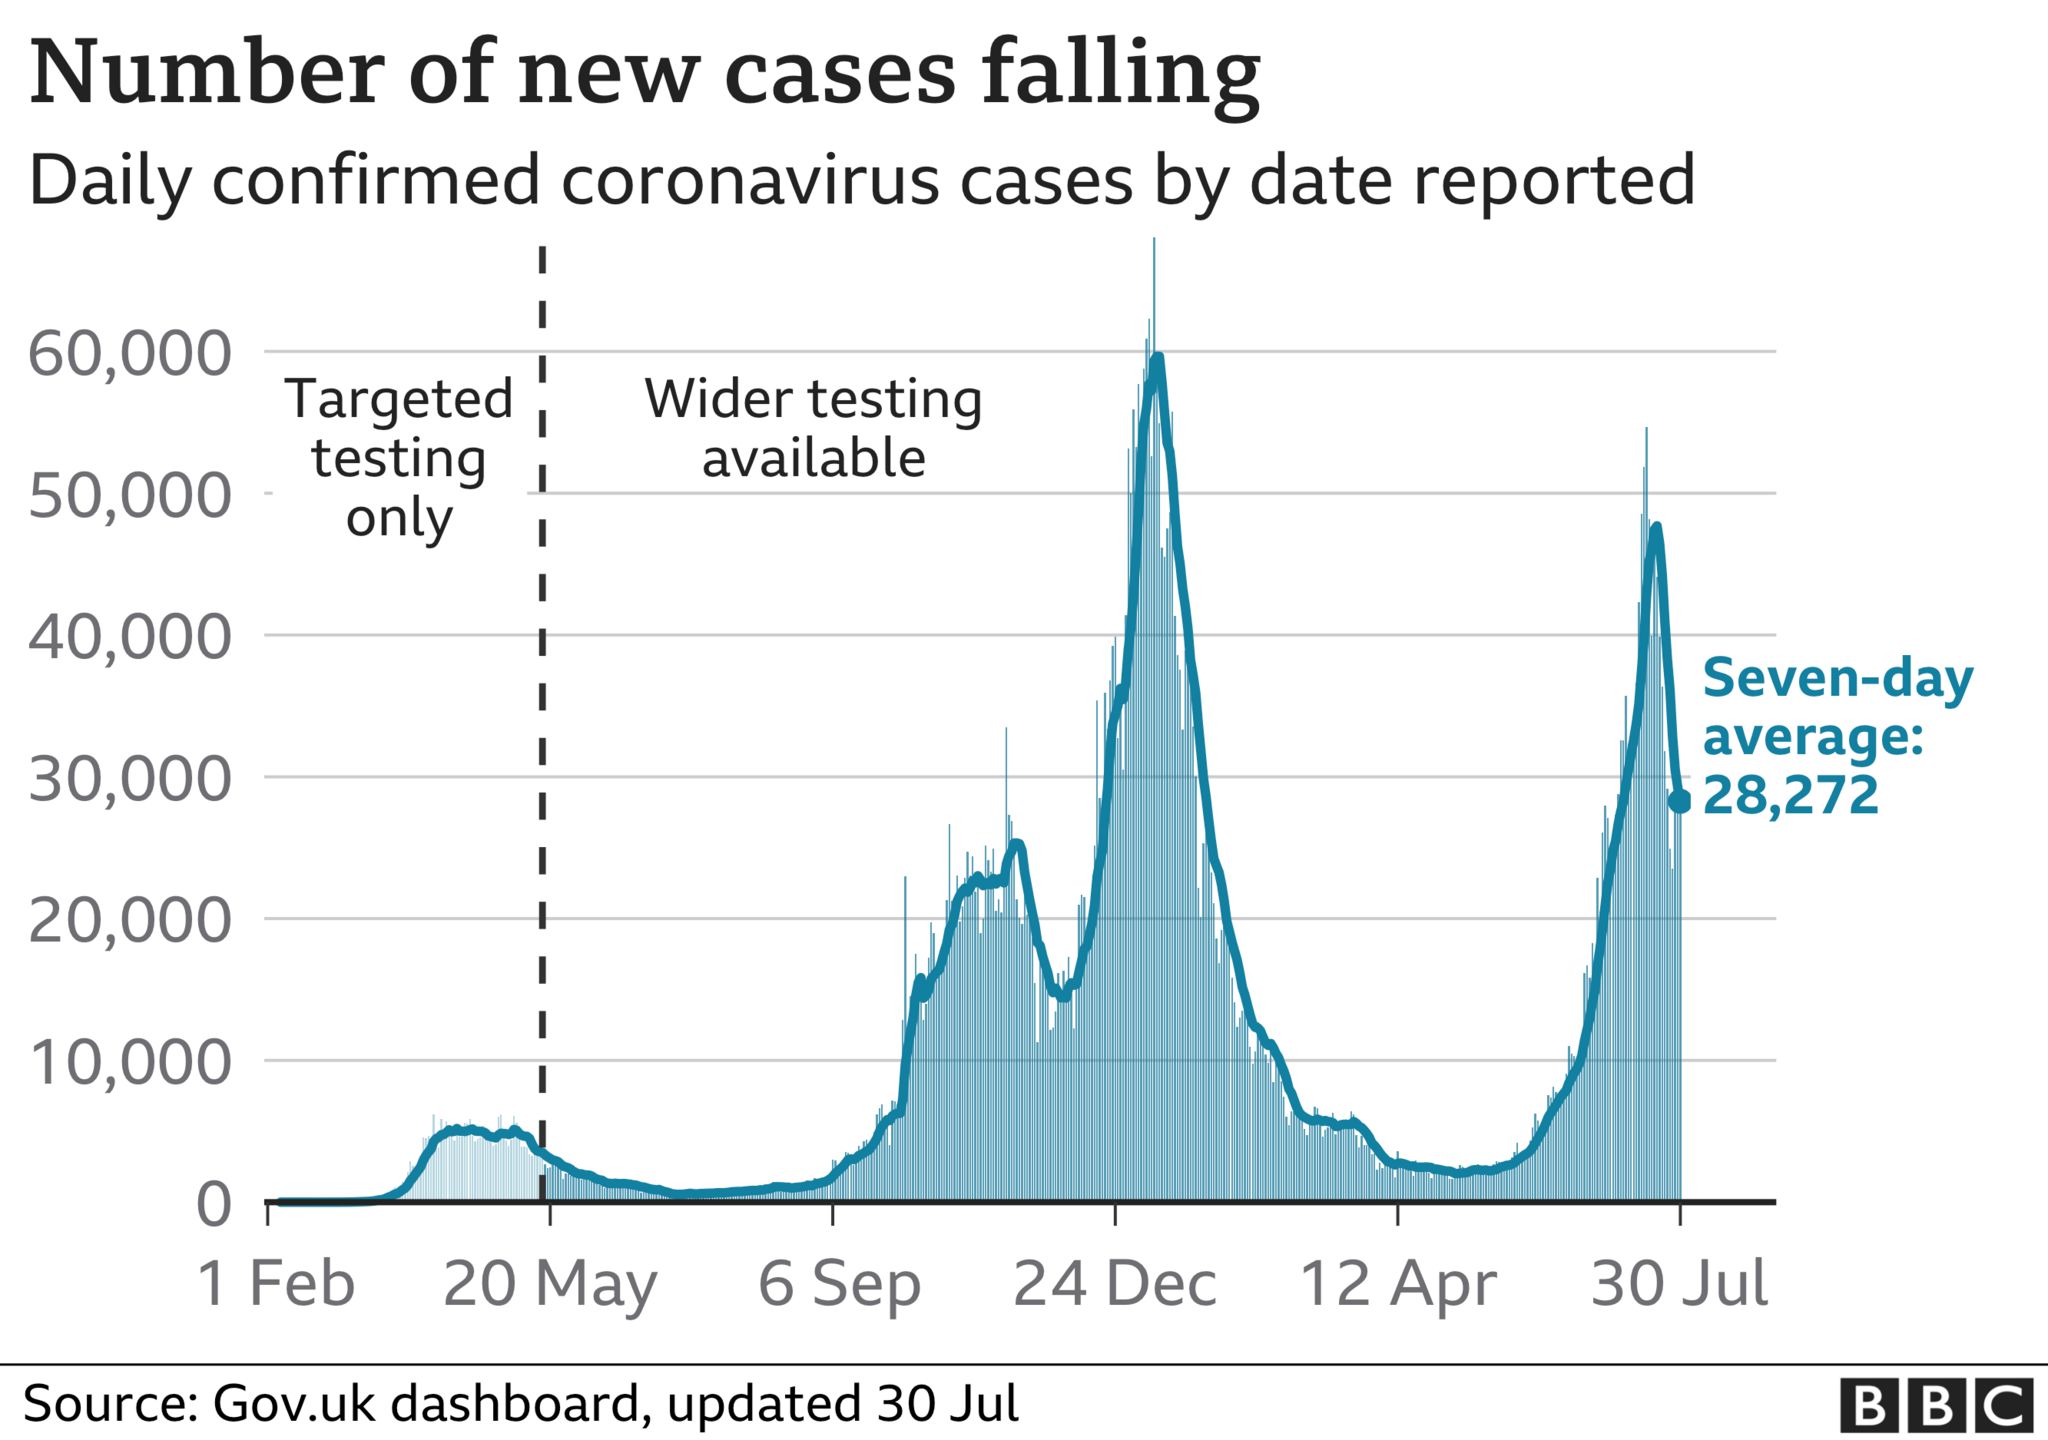
A flurry of data on the spread of Covid has not resolved debates about the state of the pandemic in the UK.
The dramatic drop in daily cases, reported widely over the past week, has not yet been backed up by other key methods that track the virus.
But equally there is no sign of a resurgence in cases linked to lifting restrictions on 19 July.
It will still take more time to get a clear picture of exactly what is going on.
« My guess is it has peaked, but I’m not confident enough to put money on it, » Prof Paul Hunter, from the University of East Anglia, told the BBC.
The main ways of tracking Covid are:
- The official number of positive test results, people in hospital and deaths
- Testing by the Office for National Statistics
- Testing by Imperial College London (which hasn’t reported)
- The R number – where anything above one means cases are still growing
- The Covid study app
However, each is both good and flawed in different ways. When they come together an overall picture can emerge, but at the moment the data is still messy.
The decline in official daily Covid cases has continued with the number standing at 29,622 on Friday, down from 36,389 on the same day last week.
However there are also early signs the number of people needing hospital treatment has levelled off across UK. If this continues it will significantly strengthen belief the fall in cases is genuine.

The weekly data published by the Office for National Statistics (ONS), which tests a random group of people to see whether they are sick or not, is seen as more reliable.
Around 40% of people in the study did not have symptoms – so it captures a bigger, less biased, picture of what’s happening than daily figures which reflect the numbers coming forward for tests, usually because of symptoms.
Yet, it is often out of date.
« There are possible signs that the rate of increase may have slowed, » said Duncan Cook, from the ONS.
However, the latest data did report an increase. It estimates just over 950,000 people in the UK would test positive in the week up to 24 July up from 830,000 the week before.
The problem with the ONS data is it is delayed twice over. The latest release only goes up to last Saturday, so misses out the declining cases in recent days. And people test positive for a time after recovering from an infection.
In interpreting today’s ONS data for England (https://t.co/wHNt68GXym), worth remembering that cases peaked in Scotland at the start of July, but this is the first week a decline has shown up in ONS report… pic.twitter.com/wJIvOmAzL3
— Adam Kucharski (@AdamJKucharski) July 30, 2021
The latest R number, another figure that is out of date, in England is between 1.1 and 1.4 – above the crucial threshold of 1.0, which would indicate cases were growing.
It means every 10 infected people would pass the virus onto between 11 and 14 other people. However, the R number largely tells us what was happening at least a fortnight ago.
But the Covid Study app, which also works in near real time, has not reported a fall in cases either.
The app, which relies on people logging on to report their symptoms, says cases have been level for the past week at around 60,000 per day.
Prof Tim Spector, from King’s College London, said: « This is in stark contrast to the rapid decline in cases recorded by the government’s official confirmed cases data.
« The drop is much faster than we’ve ever seen in previous waves, even after full national lockdowns, leaving the accuracy of the official tally in doubt. »
Resolving the conflicting streams of data will, frustratingly, take time.
Follow James on Twitter
Lancez-vous dans une nouvelle aventure avec DoingBuzz
Découvrez une multitude d'offres d'emploi et de bourses d'études adaptées à votre parcours.
Newsletter
Abonnez-vous et accédez à tous nos articles en premier !


